


 Arrays
 Converters
 Dates
Dates Numbers
 Objects
 Strings
As a JSF
developer, you know that the Render Response phase (the sixth phase) is one of
the most time-expensive of all JSF phases, next to the Restore View phase (first
phase). Well, OmniFaces provides a component, named Cache which is an server-side caching mechanism. Basically, it allows us to cache a
piece of markup produced by the JSF renderers. While the OmniFaces showcase
provides clear examples of how to use the Cache
(<o:cache>) component,
this post tries to test how useful is to cache markup on server-side. We can
easily intuit that the <o:cache>
should speed up the Render Response phase, but that will have an impact over
other aspects also, like memory usage.
So, we tried to accomplish this test for a JSF data table,
with variable number of records (rows). The table has nine columns, and it
looks like this:
...
<h:dataTable value="#{playersBean.data}"
var="t" border="1">
<h:column>
<f:facet
name="header">Ranking</f:facet>
<h:outputText
value="#{t.ranking}" style="color:red;"/>
</h:column>
<h:column>
<f:facet
name="header">Name</f:facet>
<h:outputText
value="#{t.player}">
<f:converter converterId="lowerCaseConverter"/>
</h:outputText>
</h:column>
<h:column>
<f:facet
name="header">Age</f:facet>
<h:outputText
value="#{t.age}">
<f:converter converterId="ageConverter"/>
</h:outputText>
</h:column>
<h:column>
<f:facet
name="header">Birthplace</f:facet>
<h:outputText
value="#{t.birthplace}">
<f:converter converterId="lowerCaseConverter"/>
</h:outputText>
</h:column>
<h:column>
<f:facet
name="header">Residence</f:facet>
<h:outputText
value="#{t.residence}">
<f:converter
converterId="lowerCaseConverter"/>
</h:outputText>
</h:column>
<h:column>
<f:facet
name="header">Height</f:facet>
<h:outputText
value="#{t.height}">
<f:converter converterId="heighConverter"/>
</h:outputText>
</h:column>
<h:column>
<f:facet
name="header">Weight</f:facet>
<h:outputText value="#{t.weight}">
<f:converter
converterId="weightConverter"/>
</h:outputText>
</h:column>
<h:column>
<f:facet
name="header">Coach</f:facet>
<h:outputText
value="#{t.coach}">
<f:converter
converterId="lowerCaseConverter"/>
</h:outputText>
</h:column>
<h:column>
<f:facet name="header">Born</f:facet>
<h:outputText
value="#{t.born}">
<f:convertDateTime pattern="dd.MM.yyyy" />
</h:outputText>
</h:column>
</h:dataTable>
...
This table is useful because it will produce a lot of markup
and we can juggle with the number of records (rows) which means that we can easily
control the amount of markup. Moreover, this is a fix table, so is a good opportunity
to cache its content instead of rendering it at each postback.
We've performed 5 tests without caching and 5 with caching
by varying the number of records (rows) at each test, as follows: 500, 1000,
2000, 5000 and 10000 records (rows). For each test, we have performed 5
consecutives postbacks requests (only one request executed at a time, but all 5
executed in the same minute). For each JSF phase, the initial request and the averages
times of postbacks were plotted with respect to the JSF phases (the measurements
were made using a JSF phase listener and the System.nanoTime()).
The initial request is plotted in the left, and the postbacks in the right.
In the chart below, you can see the results for 500 records
(rows):

Next, for 1000 records (rows):

Next, for 2000 records (rows):

Next, for 5000 records (rows):

Now, for 10000 records (rows):

Well, the results are pretty clear. The OmniFaces caching
was very useful and has a significant impact on server response time. Is true,
and normal, that the initial request takes longer when cache is used (since is
a extra task in the rendering phase), but the time lost here is won on
postbacks.
The Application Server
GlassFish 4 was used, and the AppDynamics revealed the following charts (the
very, very small differences that appears between the above values in
miliseconds and the below ones are caused by the fact the above values were
obtained via System.nanoTime() and the
below ones are obtained via AppDynamics, which is a powerful Application
Performance Management tool):
·
first, we have the calls per minute - the points
at scale 1 represents the initial requests, while the points at scale 5, represents
the postbacks for each run, and there are 5 different runs. Between the initial
request and the 5 postbacks, there is a minute without requests - this is
happening for each run. As you can see, the charts are the "same",
only the times of running differs, which is normal. This chart is a prove that
the tests were done under the same conditions.

·
next chart shows the average response time for
each run. Is obvious that when cache is not used, all averages are bigger than
when cached is used.

·
in order to perceive better, let's check the chart
that contains the postbacks times sum. Notice that at 10000 records (rows), the
cache will speed up the postbacks times sum with more than 3 seconds.

·
below you can see the distribution of the
slowest and the fastest responses during 5 postbacks

·
and, the slowest and fastest requests in respect
with calls per minute

·
the next chart reveals the total average response
time over the whole 5 runs (196 ms faster with cache)

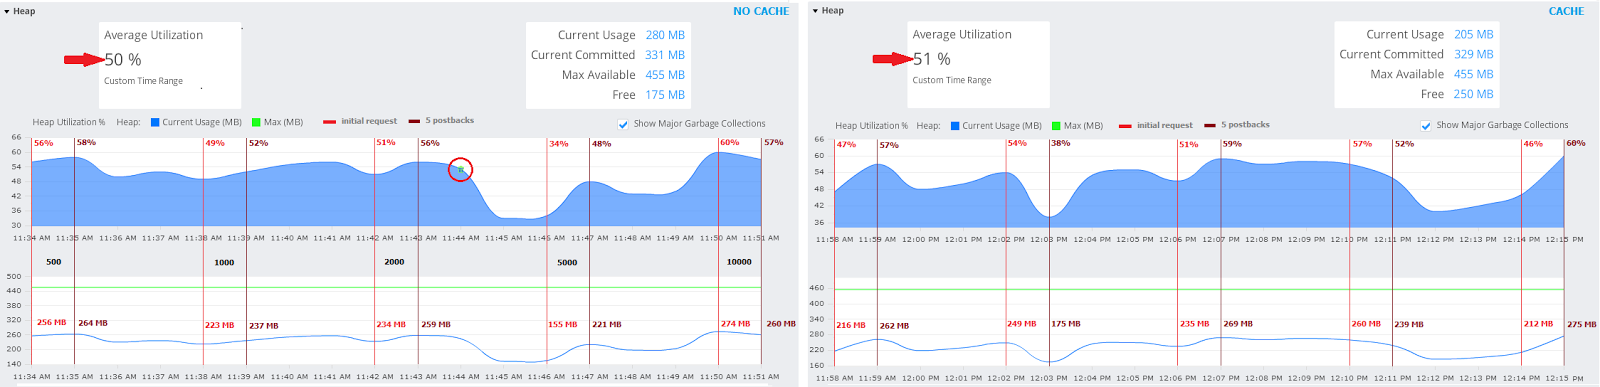
·
is time to see how the memory was distributed
over these 5 runs. So, notice that in case of cache the difference between the
average utilization of heap memory is only 1%!
For fine-grained conclusion we also may check:
·
the garbage collector usage

·
the memory pools

The test was performed under the following items:

Notice that this test doesn't involve the useBuffer="true" !!!
 <h:inputText/>
  JSF 2 Tutorials at www.mkyong.com
  JavaServer Faces (JSF) Tutorial


Niciun comentariu :
Trimiteți un comentariu